A Visual Guide to Telemarketing Performance Metrics [INFOGRAPHIC]
![A Visual Guide to Telemarketing Performance Metrics [INFOGRAPHIC]](https://www.callboxinc.com.au/wp-content/uploads/2018/03/A-Visual-Guide-to-Telemarketing-Performance-Metrics-INFOGRAPHIC.webp)

Dara Lin
Dara Lin helps companies in Australia increase their business revenue through lead generation and appointment setting services.
Telemarketing boosts marketers’ performance by delivering leads at scale and producing results in real-time. Given this channel’s current function, the success of today’s telemarketing campaigns, argues Robert Howells of the Global Marketing Associates, hinges on better use of data.
One crucial data-related aspect that needs a major rethink is telemarketing performance metrics. As the channel evolves, so do the yardsticks used to measure performance. Today’s marketers rely on a dizzying array of metrics and indicators to gauge how well each component of their strategy is working, including telemarketing. Modern telemarketing performance metrics help marketers answer five key questions about their campaigns:
- Database Quality – Is your database accurate and relevant?
- Activity and Volume – Are you making the right number of calls?
- Reach Rate – Are you talking to the right people?
- Conversions – Are calls driving the desired action?
- Costs, Revenues, and ROI – Is your campaign making or losing money?
These are the five areas to look at when evaluating telemarketing performance—whether you’re running campaigns in-house or outsourcing to an agency. In this post, we’ll go over the important telemarketing performance metrics to keep track of under each category and find out how to make informed decisions based on the numbers.
Transcript:
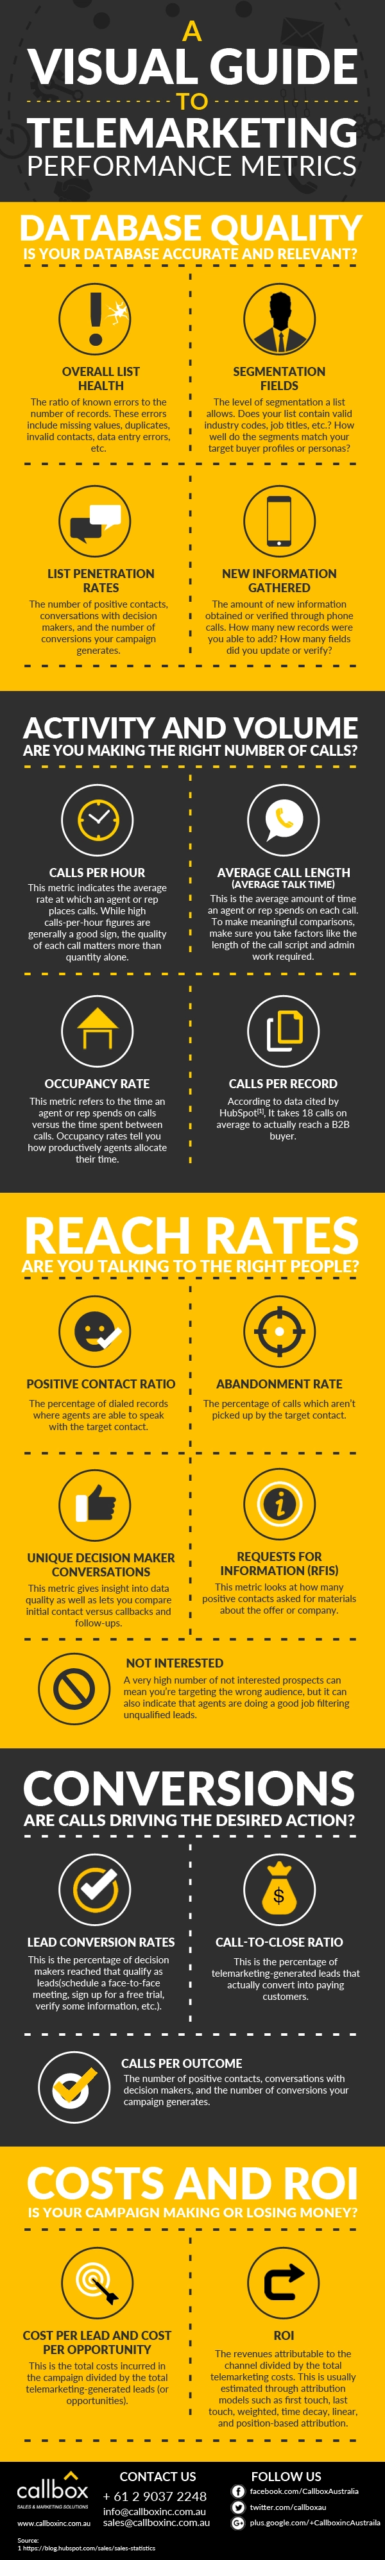
Database Quality – Is your database accurate and relevant?
Overall List Health
The ratio of known errors to the number of records. These errors include missing values, duplicates, invalid contacts, data entry errors, etc.
Segmentation Fields
The level of segmentation a list allows. Does your list contain valid industry codes, job titles, etc.? How well do the segments match your target buyer profiles or personas?
List Penetration Rates
The number of positive contacts, conversations with decision makers, and the number of conversions your campaign generates.
New Information Gathered
The amount of new information obtained or verified through phone calls. How many new records were you able to add? How many fields did you update or verify?
Related: How many times should you have your business database cleanse?
Activity and Volume – Are you making the right number of calls?
Calls per Hour
This metric indicates the average rate at which an agent or rep places calls. While high calls-per-hour figures are generally a good sign, the quality of each call matters more than quantity alone.
Average Call length (Average Talk Time)
This is the average amount of time an agent or rep spends on each call. To make meaningful comparisons, make sure you take factors like the length of the call script and admin work required.
Occupancy Rate
This metric refers to the time an agent or rep spends on calls versus the time spent between calls. Occupancy rates tell you how productively agents allocate their time.
Calls per Record
According to data cited by HubSpot, It takes 18 calls on average to actually reach a B2B buyer.
Reach Rates – Are you talking to the right people?
Positive Contact Ratio
The percentage of dialed records where agents are able to speak with the target contact.
Abandonment Rate
The percentage of calls which aren’t picked up by the target contact.
Unique Decision Maker Conversations
This metric gives insight into data quality as well as lets you compare initial contact versus callbacks and follow-ups.
Requests for Information (RFIs)
This metric looks at how many positive contacts asked for materials about the offer or company.
Not Interested
A very high number of not interested prospects can mean you’re targeting the wrong audience, but it can also indicate that agents are doing a good job filtering unqualified leads.
Related: How to Handle Early Sales Objections, According to Science [VIDEO]
Conversions – Are calls driving the desired action?
Lead Conversion Rates
This is the percentage of decision makers reached that qualify as leads(schedule a face-to-face meeting, sign up for a free trial, verify some information, etc.).
Call-to-Close Ratio
This is the percentage of telemarketing-generated leads that actually convert into paying customers.
Calls per Outcome
This metric tells you how many calls it takes to get a result (conversion). Calls per outcome measures how efficiently a campaign generates results and you largely want to minimize this metric.
Related: Top 10 Proof that Outbound Efforts Help Close Deals in Australia
Costs and ROI – Is your campaign making or losing money?
Cost per Lead and Cost per Opportunity
This is the total costs incurred in the campaign divided by the total telemarketing-generated leads (or opportunities).
ROI
The revenues attributable to the channel divided by the total telemarketing costs. This is usually estimated through attribution models such as first touch, last touch, weighted, time decay, linear, and position-based attribution.